Compare. Control. Improve. Instantly.
Live benchmarking to spot top and underperforming sites before it costs you.

Benchmark. Compare. Improve.
Actionable trends and strategies for hospitality leaders.

Smarter features. Sharper results.
Discover new tools for faster, clearer reporting.

Consistency at every site.
Methods to boost efficiency and profit group-wide.
Auto reporting flags underperformance fast
Automated reports highlight issues before they escalate.
Leaderboards reveal top sites
Motivate teams with real-time performance rankings.
Export reports instantly
Send benchmarking packs to your team in seconds.
Drill down to site details
Review rotas, invoices, and notes for each location.
Compare any time range
Track daily, weekly, or monthly results easily.
Monitor key KPIs
View sales, labour %, GP, and more per site.

From insight to action—start now
Turn live benchmarking into better decisions. Compare sites, spot issues early, and drive consistent performance across your group.
“Instant benchmarking revealed performance gaps across our sites. We acted fast, focused our team, and shared clear, actionable data.”
Your benchmarking questions, answered
Clear, direct answers for multi-site operators and finance teams.
How many sites can I benchmark?
Benchmark unlimited locations—no cap on site count. Built for multi-site groups.
Can I create area-level dashboards?
Yes. Custom dashboards for managers, directors, or finance—see only what matters.
Is manual data entry needed?
No. Data syncs automatically from rotas, invoices, and POS for up-to-date insights.
Which metrics are available?
Track labour %, net sales, GP, stock, rota efficiency, and more. All key KPIs included.
How often is data refreshed?
Data updates daily for near real-time performance and trend visibility.
Can I export benchmarking reports?
Yes. Download or schedule weekly benchmarking packs for ops and finance teams.
Benchmark Every Site. Instantly.
Live, side-by-side performance data for every location. Spot trends, act fast, and drive results with Opsyte’s benchmarking tools.

Compare Sites. Uncover Insights.
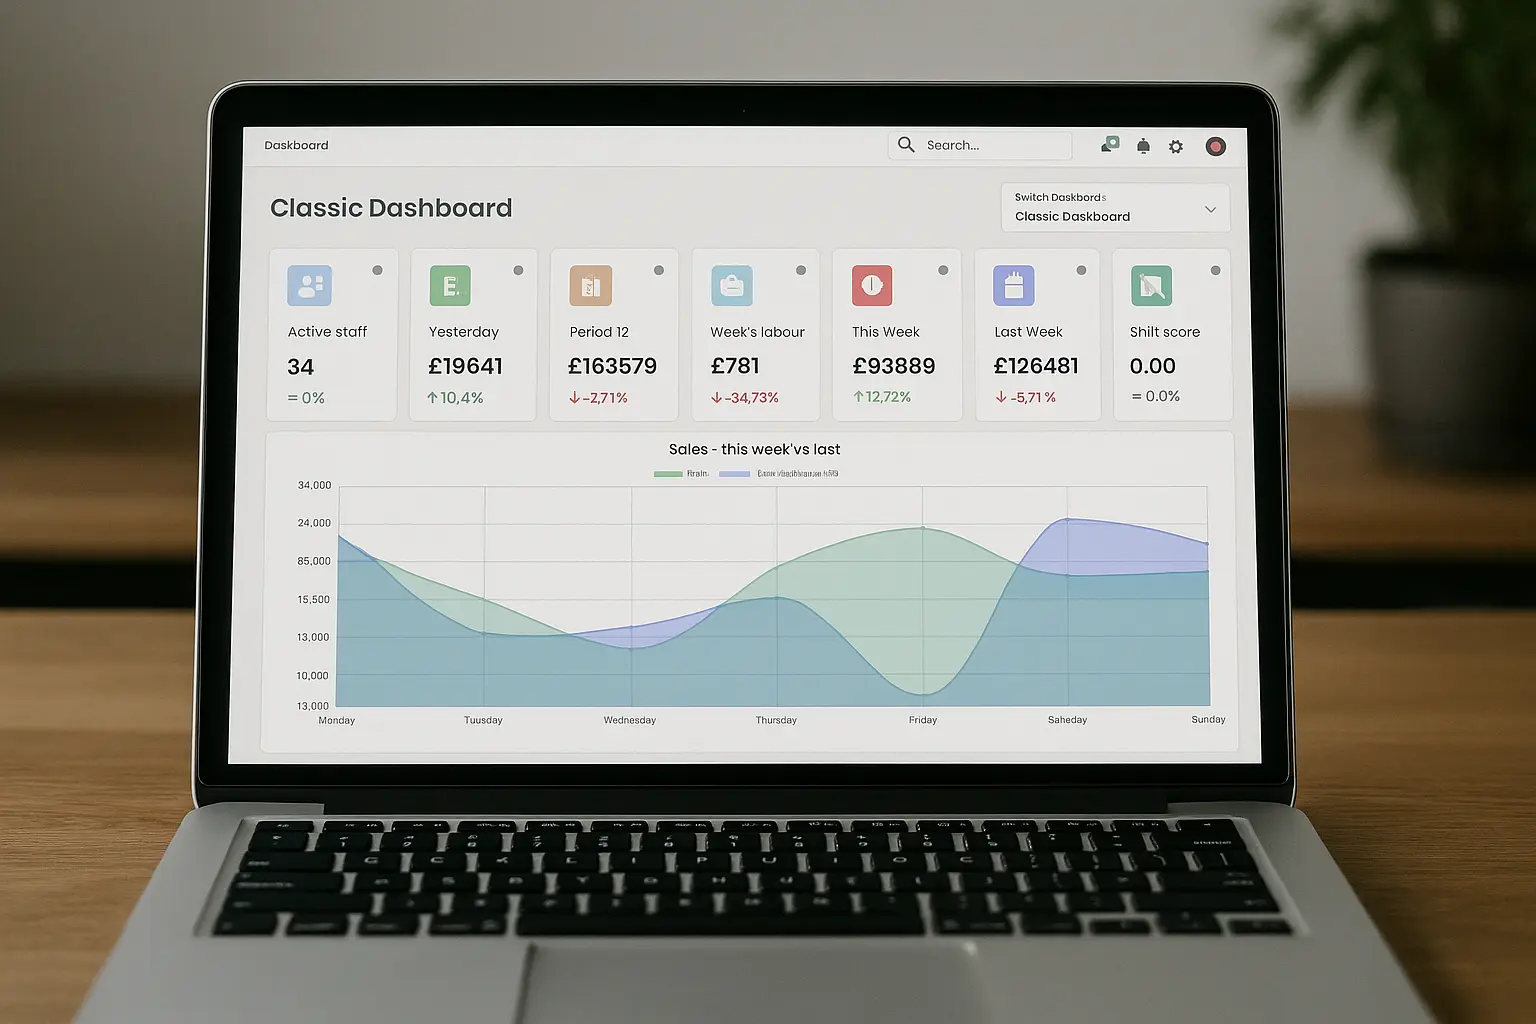
See sales, labour %, and GP at a glance. Identify top and underperformers with real-time data.
Act on Data, Not Guesswork
AI-powered alerts highlight issues before they impact your bottom line. Make informed, strategic decisions.
Compare Sites. Control Performance.
Instantly see how each location stacks up. Identify top performers, spot underperformance, and drive results with real-time data.
Spot Issues Before They Cost You
Get side-by-side comparisons on sales, labour %, and GP. Make informed decisions—no more guesswork.
Catch Underperformance Instantly
AI variance alerts highlight cost drifts and inefficiencies, so you can act before they impact your bottom line.
Scale With Consistency, Not Surprises
Monitor every site from one dashboard. Export reports, drill down into details, and benchmark with confidence.

Site-by-Site Performance KPIs
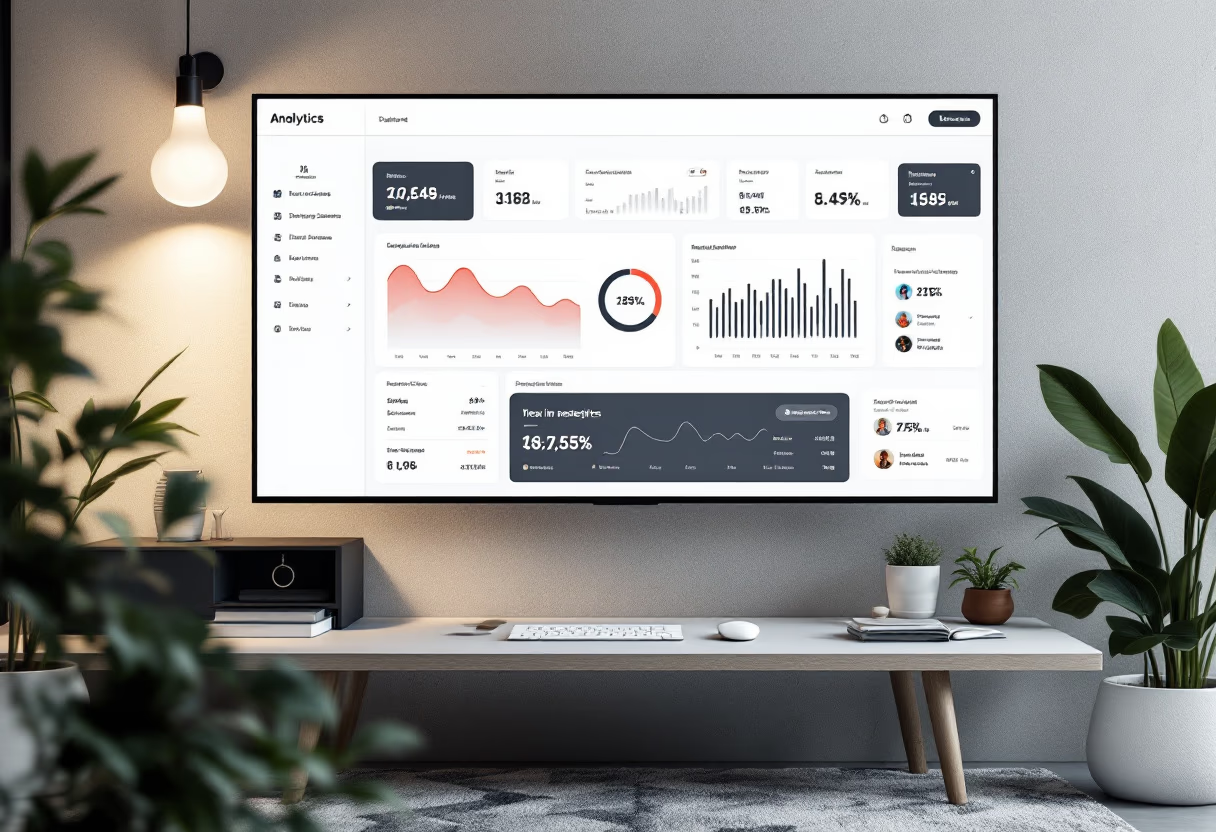
Instantly compare sales, labour %, and GP across all your locations. Spot trends and outliers at a glance.
AI-Powered Variance Alerts
Get automatic notifications when a site underperforms. Address issues before they impact your bottom line.

Leaderboards & Deep Drilldowns
Rank sites by profitability, efficiency, or sales. Click into any site for detailed rotas, invoices, and notes.
Benchmark Smarter. Operate Stronger.
Site-by-Site KPIs
Instantly compare sales, labour %, and GP across all locations. Spot trends and outliers at a glance.


AI Variance Alerts
Get automatic alerts for underperformance. Address issues before they impact your bottom line.

Leaderboards & Drilldowns
Rank sites by profitability and efficiency. Click into any site for detailed performance insights.
Exportable Reports
Weekly benchmarking packs sent to ops and finance leads. Share actionable data with your team.
![[background image] image of an inviting urban street near the restaurant](https://opsyte.com/images/a79e14d7-52da-4934-a705-5d8a2348de3b.avif)
Ready to simplify hospitality ops?
We’ve got you.
Speak with an Opsyte expert to see how we help:
- Save hours on staff scheduling and rota planning
- Automate invoice processing and financial insights
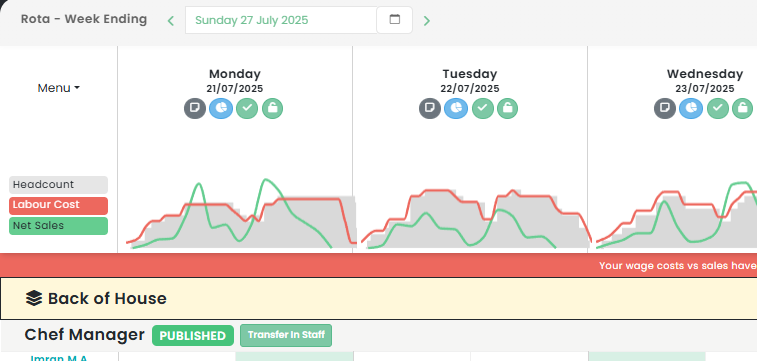
- Track live labour costs vs sales in real-time
- Get fast answers and support from real humans
- Automate your P&Ls

“Opsyte transformed our entire back office. Game changer.”
Read articles from our hospitality experts
-
Boosting Efficiency in the Hospitality Industry: The Integral Role of Employee Scheduling Software in Staff Management and Workforce Organization
Unlocking Efficiency in the Hospitality Industry with Employee Scheduling SoftwareThe hospitality industry in the UK, like the hotel and restaurant sectors, is a vibrant, fast-paced environment that requires efficient staff…...
-
Understanding the Impact of Minimum Wage Laws on Restaurant Labor Costs: Insights into Wage Standards, Employee Salary, and Income in the Hospitality Industry
Understanding the Minimum Wage in UK Restaurants and its Impact on the Hospitality IndustryThe hospitality industry, especially restaurants, are a cornerstone of the UK economy, employing a substantial number of…...
-
Leveraging Restaurant Management Systems for Effective Operations in the Hospitality Industry: A Comprehensive Report on Solutions and Efficiency
Restaurant Management System Report: Revolutionising UK Hospitality IndustryThe hospitality industry, especially the restaurant sector, is a challenging and competitive space that demands efficient management and operation. The implementation of a…...
-
Maximising Restaurant Profits: Successful Strategies for Boosting Revenue and Enhancing Profitability in the Hospitality Industry
How to Enhance Restaurant Profitability: A Comprehensive GuideRestaurant profitability is key to the survival and success of any establishment in the hospitality industry. However, it is a complex process that…...
-
Leveraging Catering Software Programs for Efficient Hospitality Management and Event Planning: An Insight into the World of Food Service Software Solutions
Catering Software Programs: Revolutionising the UK Hospitality IndustryThe UK hospitality industry is a dynamic and challenging sector, with catering and event planning at its heart. The recent technological advancements have…...
-
Boosting Your Bar Business: Smart Marketing Strategies and Successful Promotion Ideas for the Hospitality Industry
Promoting a Bar: Innovative Ideas to Boost Your BusinessThe hospitality industry in the UK is dynamic and competitive, with bars constantly vying for loyal patrons and new customers. With the…...
